
Data-Driven Insights
Privacy Policy: All images, data, and information presented in the case studies on this digital portfolio website are strictly for educational purposes. Unauthorized use, reproduction, or distribution of the content is prohibited, and the confidentiality of the depicted projects and associated information must be respected. All identifying information has been removed, as the intent of the “case study” and “sample” information is for educational purposes only.
Case Study 1: Web Content Management
This case study details a look at an annual “midyear campaign” for an #EdTech company. For this campaign, I specifically curated the messaging and content for the homepage, including a carousel of 3 compelling images linked to promoted pages and ticker messaging that ran across the top of the homepage.
Image 1: This image is a slide presented to executive leadership detailing my insights and learnings, once the data was analyzed, from the promoted midyear campaigns of two concurrent years.
Image 2: This image contains the metrics measured from the midyear campaign comparisons of two concurrent years. The data reflects great engagement and conversion rates. Our biggest win was a 67% increase in enrollments as a direct result of the implemented changes to the midyear campaign!
Case Study 2: Meta/Facebook (FB) and Instagram (IG)
This case study details the outcomes of my most recent experience as a corporate individual contributor (Senior Social Media Strategist). The lifespan of my ownership of this organization’s FB and IG pages was about 6 months. The data range for the images below is inclusive of that time in direct comparison to the same 6 months from the previous year.
The results of my time with this organization include exponential growth, increased reach, and increased engagement. The images below contain some of those successful metrics and insights.
Image 1 - FB & IG Reach: Page reach for FB increased 118% to 6.3M. Page reach for IG increased 85% to 942K. Audience growth, engagement rates, and even posting frequency were all increased.

Image 2 - FB & IG Reach: In my last week of owning the channels, we peaked at a successful page reach of 2.7M on FB and 298K on IG.

Image 3 - IG Engagement: The engagement for IG increased by 0.6% to 4.7K likes, comments, & shares from the last 90 days vs the 90 days prior.
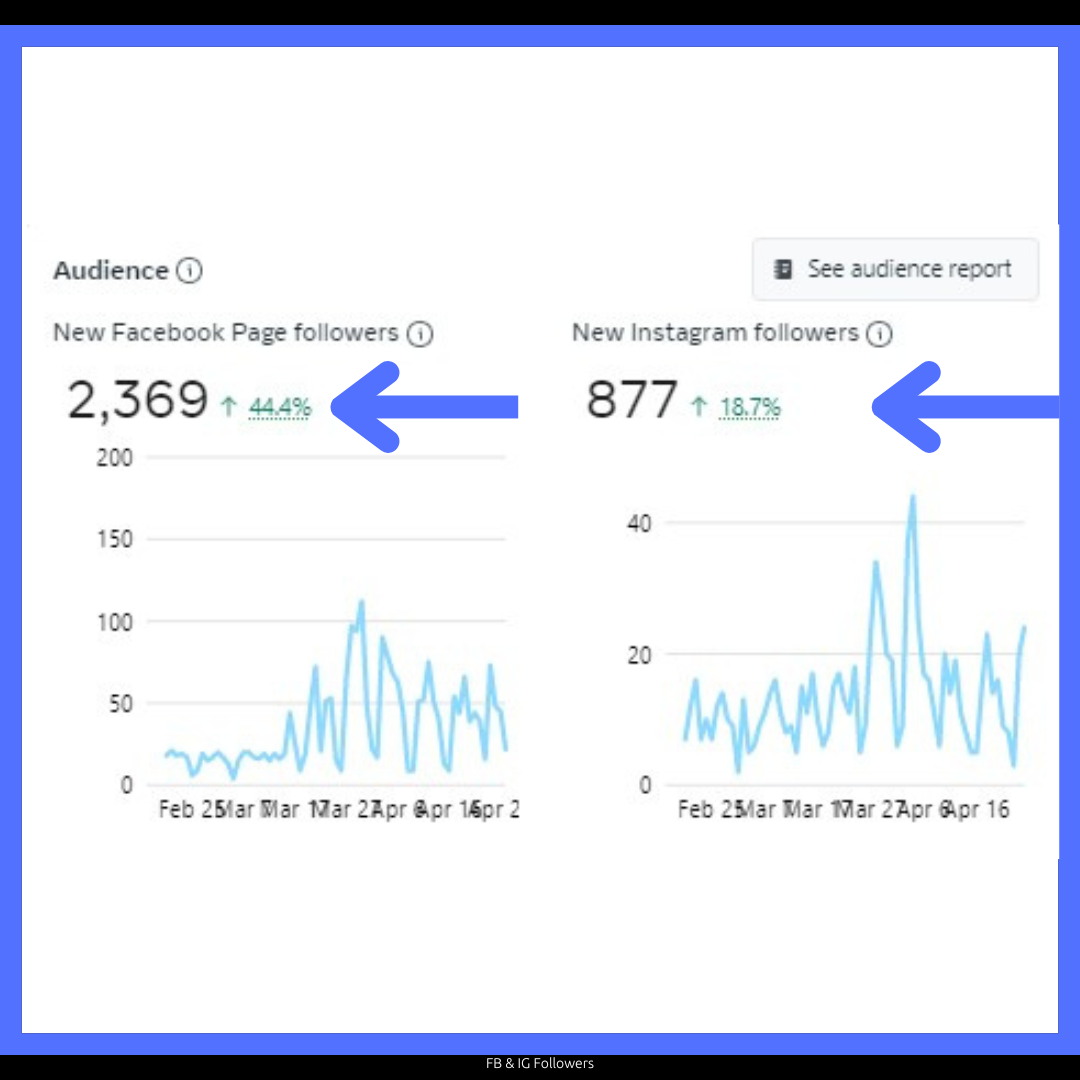
Image 4 - FB & IG Followers: Followers for both accounts increased. FB followers increased by 44%, with 2,369 new followers and IG followers increased by 19% with 877 new followers.
Image 5: IG Top-Performing Posts: A learning here was that posts that were educational in nature, but interactive in concept (trivia posts), as well as student success stories, performed the best for my #EdTech client. Reach, engagement (likes), and comments all increased as a result of these types of posts.
Case Study 3: Snapchat Filter
This case study details the implementation of a brand’s first activation of a Snapchat filter. The range for the target audience was relatively small. The geo-location range was about 68,000 square feet (the brand’s headquarters).
Since the target audience was employees, I developed and disseminated two targeted emails promoting the Snapchat filter, commissioned in honor of the brand’s profit-sharing day announcement, and went live on the brand’s FB instance to boost adoption and engagement.
The results of the social experiment are included below.
(Samples of commissioned Snapchat filters, including the one used in this case study, can be found in the Snapchat Filter Designs section of the Social Portfolio menu.)
Image 1: Our playful experiment of a Snapchat filter proved to be a success, with a reach of 8.1K! End users said our filter “sparked joy” and “helped create vibrant and engaging moments” that resonated with our audience. This resulted in many more Snapchat filter commissions and increased engagement.